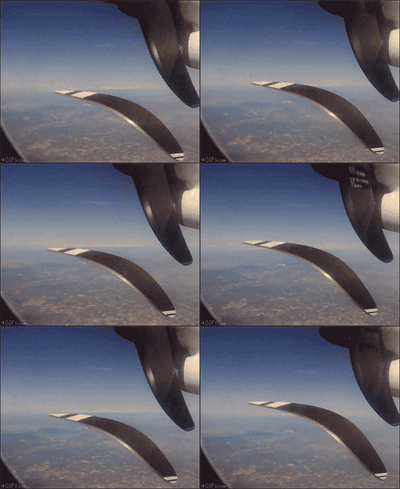
In a rolling shutter camera (most USB cameras), the image rows are exposed sequentially, from top to bottom. It follows that the various parts of the resulting video image do not exactly correspond to the same point in time. This is definitely a problem when using these videos for measuring object velocities or for camera synchronization. Basically the only bright side is that it makes propellers and rotating fans look funny.

Fig. 1. Rolling shutter artifacts when imaging a propeller.
But beside the visual distortion, can we quantify how severe the problem is? Let’s find out with a simple blinking LED.
Principle
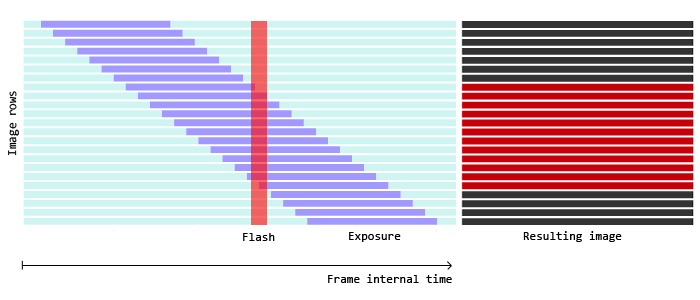
The exposure duration is independent from the rolling shutter. Each row is properly exposed as configured, it’s just that the start of the exposure of a given row is slightly shifted in time relatively to the previous one. So if we flash a light for a very short time in an otherwise dark environment, only the rows that happen to be exposed at that time are going to capture it.

Fig. 2. Rolling shutter model with a flash of light happening during frame integration.
An Arduino can serve as a cheap stroboscope for our purpose. The principle is simple, we align the LED blinking frequency on the camera framerate so that exactly one flash happens for each captured frame. We limit the flash duration to reduce the stripe of rows catching it, and we measure the height of the stripe in pixels. Considering we know how long each row in the stripe has been collecting light and how long the flash lasted, we can compute the total time represented by the rows and derive a per row delay.
Experimental setup
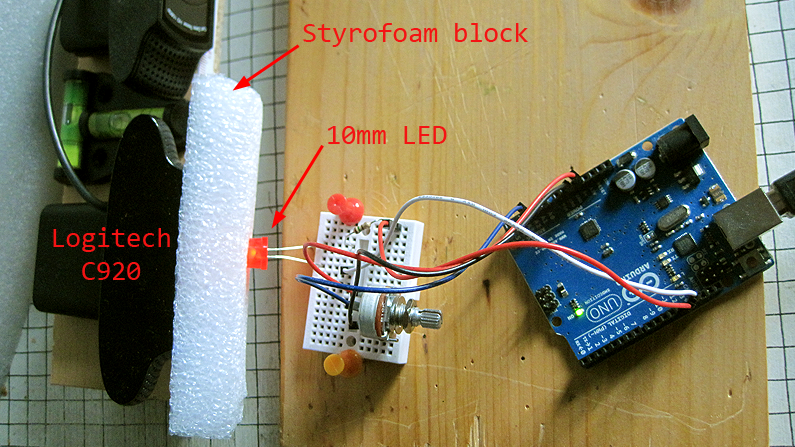
As we are going to count pixels on the resulting images we want the clearest possible differentiation between lit rows and unlit rows and we want the entire row to be lit. For this I’m using a large LED (10 mm) and a diffusion block. The diffuser is simply a piece of Styrofoam 2 cm thick, with the LED head stuffed in about 5 mm deep (works better than a ping pong ball).
All timing relevant code in the Arduino is done using microseconds (more about accuracy below).

Fig. 3. Experimental setup.
On the camera side, I manually focused to the closest possible, and set the exposure time to the minimum possible, which is 300 µs on the Logitech C920. I used Kinovea to configure the camera.
Note that not all camera have a control for exposure duration. Furthermore the usual DirectShow property does not always map precisely to the firmware values. Logitech drivers expose a vendor-specific property with the adequate control of exposure.
The LED with the diffuser is crammed close to the camera lens to get as much light as possible from the flash.
First attempt
After configuring the camera to 800×600 @ 30 fps, and the Arduino to blink the LED for 500 µs every 33333 µs, we get a nice Cylon eye stripe:

Fig. 4. Stripe of illuminated rows, with strobing frequency mismatch.
Interesting. A stripe corresponding to the few rows that were exposed during the LED flash… But slowly moving up. Either the camera is not really capturing frames at 30 fps like it advertises, or the Arduino clock is not ticking exactly 30 times per seconds, or a bit of both.
Arduino’s micros() has a granularity of 4µs but it is definitely lacking in accuracy. It suffers from drift and cannot be used if long term accuracy is required. For our purposes, the difference between, say, 30.00 fps and 29.97 fps is about 33 µs which is well under the board capabilities. A Real Time Clock would be needed.
So our blinking interval is slightly off, but fortunately it does not really matter for our experiment as we are not trying to measure the camera frequency itself. As long as we can somehow tune to it and stabilize the stripe, we do not need to know its exact value.
The stripe is moving upward, meaning that for each frame, we fall a bit short, and the flash is happening at a lower time coordinate in the frame interval, illuminating higher rows.
At that point I added a potentiometer (plus code to average its noisy values) and linked it to the blinking rate, so that I could more easily fine tune to the actual camera framerate. Manually bisecting the values until the stripe is stable is also quite feasible in practice.
The stripe stabilized when I settled on 33376 µs. It is a meaningless value in itself and we are not going to convert that back to a framerate.
Measurements
We should now have everything needed to compute the rolling shutter time shift.
Here are some captured frames with fixed camera exposures and varying LED flash durations. Each time we restart the camera the stripe will be at a different location, but it stays put.

Fig. 5. Capturing the LED flash. Fixed exposure of 300 µs, varying flash duration 500 µs, 1000 µs, 2000 µs.
A few measurements are summarized in the following table:

Table 1. Rolling shutter row delay measurements at various exposure and flash duration.
The row delay is given by \( \frac{ \text{exposure} + \text{flash duration}}{ \text{row count}} \). We get an average time shift of about 56.6 µs per row. Considering the 800×600 image, that gives a full image swipe of 33981 µs. In other words, a 34 ms lag between the top and bottom rows.
Other methods
Other methods have been designed to compute the rolling shutter without knowing the camera internals. Most notably a rough but simple method is to film a vertical pole while panning the camera left and right. This allows to compare the inter-frame and intra-frame displacement of the pole and retrieve the full image swipe time. If between top and bottom rows in a single frame the pole is displaced by half as many pixels than what it is displaced between the top rows in two adjacent frames, we know the vertical swipe time is half the frame interval. See more details here, several measurements are required to average out the imprecisions.
The 34 ms value is probably consistent with the type of sensor quality we would expect to find in a webcam compared to a device dedicated to photography. For DSLR, values of 15 ms to 25 ms are reported using the pole technique, and up to more than 30 ms as well for some devices.
Image size
The frame scan time may or may not change depending on the chosen resolution. It depends on the way image sizes that are lower than the sensor full frame are implemented in the camera.
Methods to create lower sized images include downscaling (capture the whole image and interpolate at the digital stage), pixel binning (combine the electrical response of two or four pixels into a single one), cropping (use only a region of the full frame corresponding to the wanted resolution). Pure downscaling will give the same frame scan time between image sizes. Cropping will change the scan time as there really are less pixels to read out.
A particular resolution may use a combination of methods. For example, a 800×600 image on a 1920×1080 sensor may first use cropping to retrieve a 4:3 window of 1440×1080, and then downscale this image by 1.8x to get 800×600.
To know if a resolution is downscaled or cropped we can check the horizontal and vertical field of view that this image displays and compare it to the field of view in the full frame image.
Conclusion
34 ms of disparity within an image is definitely a lot when filming fast motion like a tennis serve or golf ball trajectory. A mitigation strategy is to orient the camera in such a way that the motion is parallel to sensor rows. For stereoscopy or multiple-camera vision applications, a sub-frame accurate synchronization method might be required (usually through a dedicated hardware cable). A global shutter device is of course always a better option.